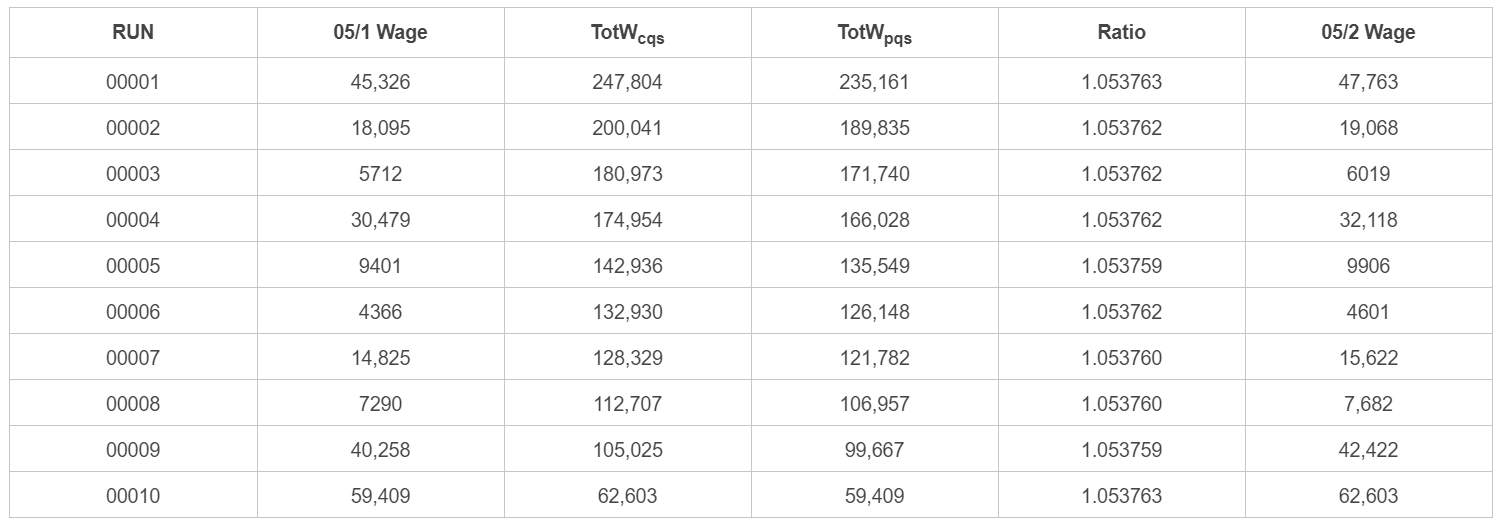
10 total wage proration example
Total Wage Proration Example
A multi-unit family consisting of 10 reporting units had full reported data in quarter 2005/1. The master account's contribution report data had been entered for the second quarter, but the 2005/2 MWR form had not yet been received. The 2005/1 total wages for the master account were $235,166, with $247,804 reported for 2005/2. The ten worksites (reporting units numbered 1 to 10) had 2005/1 total wages of $45,326 (RU #1), $18,095 (RU #2), $5712 (RU #3), $30,479 (RU #4), $9401 (RU #5), $4366 (RU #6), $14,825 (RU #7), $7290 (RU #8), $40,258 (RU #9), and $59,409 (RU #10), summing to $235,161. The family was out-of-balance by $5 in quarter 2005/1, but no adjustment was attempted since all of the data were reported. The proration of total wages for the family in 2nd quarter is computed in the manner shown in the table that appears below. Note that the "Ratio" field does not remain constant, since it is computed as the ratio of the remaining current quarter total wages to the remaining prior quarter total wages (TotWcqs¸ TotWpqs). The variations show the amount that rounding has created an anomaly in the original ratio. Multiple roundings in the same direction will eventually be offset by rounding in the opposite direction.
Note: The worksite sums used in the prior quarter values (the pqs subscript) will exclude any of the worksites that were active in the previous quarter but inactive in the estimated quarter. If this were not in effect, estimates would be short by the total wage amounts represented in the inactivated worksites, which would cause an extensive amount of manual intervention to reconcile the out-of-balance condition. This is more fully described with an example in the Employment Estimation section.
In the table above, the first column is the reporting unit number (RUN). The second column shows the worksite's 2005/1 total wage value. The third column is the current quarter's (2005/2) master total wage value less any current quarter worksite estimates made thus far. The fourth column denotes the prior quarter summed worksite total wages less any prior quarter total wages already accounted for in prior lines. The fifth column is the ratio of current to prior quarter wages, and the sixth column is the worksite's estimated total wage value for the new quarter.
The first worksite uses the full master account total wage value divided by the prior quarter's summed worksite wages to produce the first ratio. This ratio is multiplied by the 2005/1 worksite total wage field to produce the estimate for quarter 2005/2's total wages for the worksite. Then the first reporting unit's prior quarter wage value is subtracted from the column 4 value to give the next line's revised prior quarter wage sum. The estimated worksite's total wage value for the current quarter is subtracted from the column 3 value to produce the second line's current quarter wage sum. The same process is repeated through the family. As rounding causes a particular unit's total wage value to vary slightly from the original ratio, the adjusted current and prior quarter summed values produce a revised ratio to counterbalance the discrepancy. This is like an autopilot device to keep the proration from straying off course. The magnitude of the ratio shifts in this example vary by no more than 1 part in 400,000 in either direction, but it allows the resultant family estimate to balance precisely between the master and summed worksite wage values, even when the prior quarter was slightly out of balance. Using a constant ratio for worksite distribution produces an average variance from exact balancing that increases as the number of worksites increases. The estimated departure from an exact balance in either wages or employment is found from the equation:
This is of little concern for small families, but a family with 1000 reporting units would be off, on average, by 16 units (i.e., $16 or 16 employees). Although this would still be of minimal impact on total wage data, employment balancing can become much more significant. The counterbalancing mechanism has been selected for its efficacy in smoothing out the family estimation bumps.
Related Links
